DISTRICT 1
Cooperative Eco-Utility Community
Winnsboro Franklin Parish Louisiana Area
Comprehensive Master Plan, Regulatory Roadmap, Revenue Model, Engineering Layout, and Governance Framework
Revenue Bond for Grant Investment
$30.8M
Net present value
(NPV)
Offer Residents 30% Matching (Non-IPO Shares)
Starting at $1
$5.3M
Quantifiable investment stock over three years
$5.1M
Qualify Bonds offer from Future Cash Discount
$20.4M
Development cost for consolidating working capital
1. Executive Summary
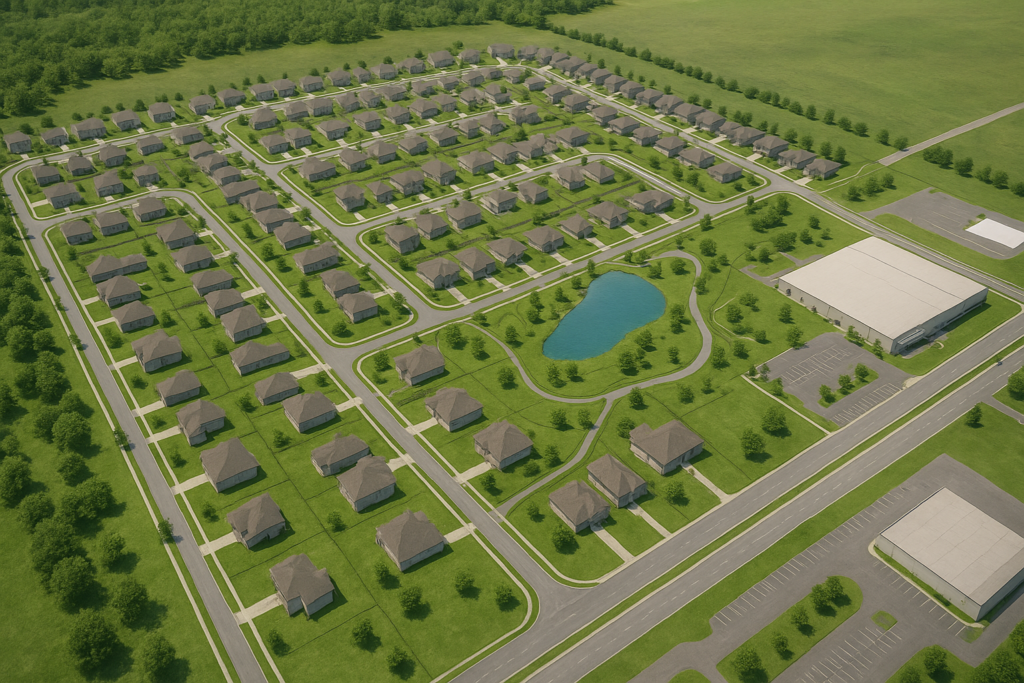
DISTRICT 01 is an Eco-Utility Community Investment Project that is located on 266 acres along Highway 15 in Winnsboro- Franklin Parish, Louisiana, approximately 20 miles south of Interstate 20. This shall be prime location that provides excellent transportation access for residents, commercial partners, and logistics operations.
Directly across the highway, a 46-acre industrial warehouse campus—offering over 650,000 sq ft of warehouse space within the Winnsboro Industrial Park—will be integrated into the DISTRICT 01 economic ecosystem. This facility will support wastewater-derived product processing, packaging, storage, and distribution, enhance job creation and strengthening the community’s revenue base. The warehouse property benefits from overhead sprinklers, industrial access roads, and an estimated replacement value exceeding $16 million.
Additionally, the community is strategically positioned 28 miles from the Holly Ridge META artificial intelligence data center project, creating opportunities for utility support, reclaimed water supply, logistics integration, and employment for residents.
DISTRICT 01 is a 266-acre master-planned residential subdivision designed around a resident-owned wastewater resource recovery utility. The community converts wastewater into reclaimed water, Class A biosolids, renewable natural gas (RNG), and struvite fertilizer. These revenue-generating activities support a dividend program through resident-owned stock and revenue bonds.
2. Land Use Plan
2.1 Residential + Community Core (266 Acres)
- Entire 266 acres dedicated to the community subdivision: residential lots, parks, community amenities, roads, greenways, and public spaces.
- Residential Lots & Neighborhoods: Flexible mix of lot sizes and product types (single-family, townhomes, small-lot cottages, and estate lots) distributed across the full 266 acres.
- Community Amenities & Parks: Integrated throughout the 266-acre footprint.
- Roads & Utilities: Network planned to support full-density residential build-out across all acreage.
- Future Development Reserve: Strategically placed within the 266 acres for phased buildout.
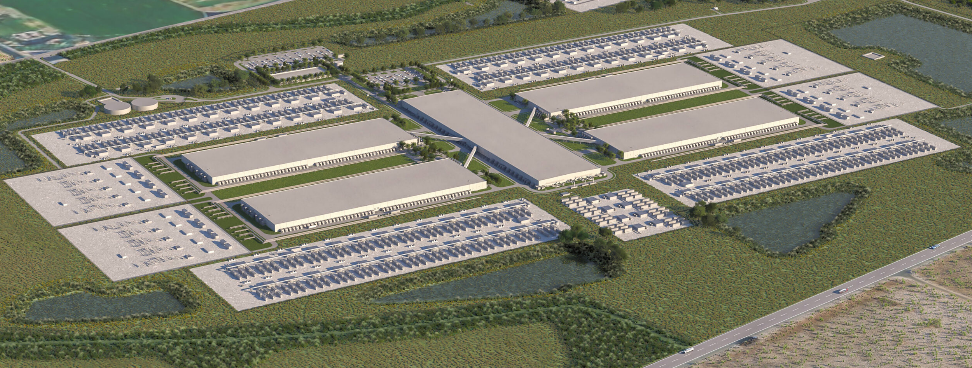
2.2 Industrial Campus (46 Acres Across Highway 15)
The industrial campus will serve as the primary site for Wastewater Product Processing & Distribution as following:
- Warehouse Space (650,000+ sq ft): Storage, curing, packaging, and distribution of biosolids, struvite fertilizer, and reclaimed water products.
- RRF Support Operations: Equipment maintenance, mobile treatment units, fleet parking.
- Energy & Technology Facilities: Space for expanding solar infrastructure, RNG compression, and battery storage.
- Employment Hub: Stable jobs for SEUC residents across logistics, packaging, engineering, operations, and distribution.
2.3 Strategic Advantages
- Only 20 miles south of I-20, ideal for commercial transport and product shipping.
- Proximity to the Holly Ridge META AI Data Center Project (28 miles) creates long-term demand for:
- Reclaimed water for cooling support (if required by META’s environmental operations plan)
- Local workforce support
- Renewable energy partnerships
- Regional industrial synergies
META AI Data Center
The industrial site is essential for large-scale distribution and commercialization of all wastewater-derived products, enabling the community to function as a truly circular and economically self-sustaining ecosystem.
- Future Development Reserve: 100 acres
- Residential Lots: 60 acres (400–800 homes)
- Community Amenities: 25 acres
- Resource Recovery Facility (RRF): 10 acres
- Solar + Energy Park: 10 acres
- Constructed Wetlands / Eco-Park: 20 acres
- Open Space / Buffers: 20 acres
- Roads & Utilities: 21 acres
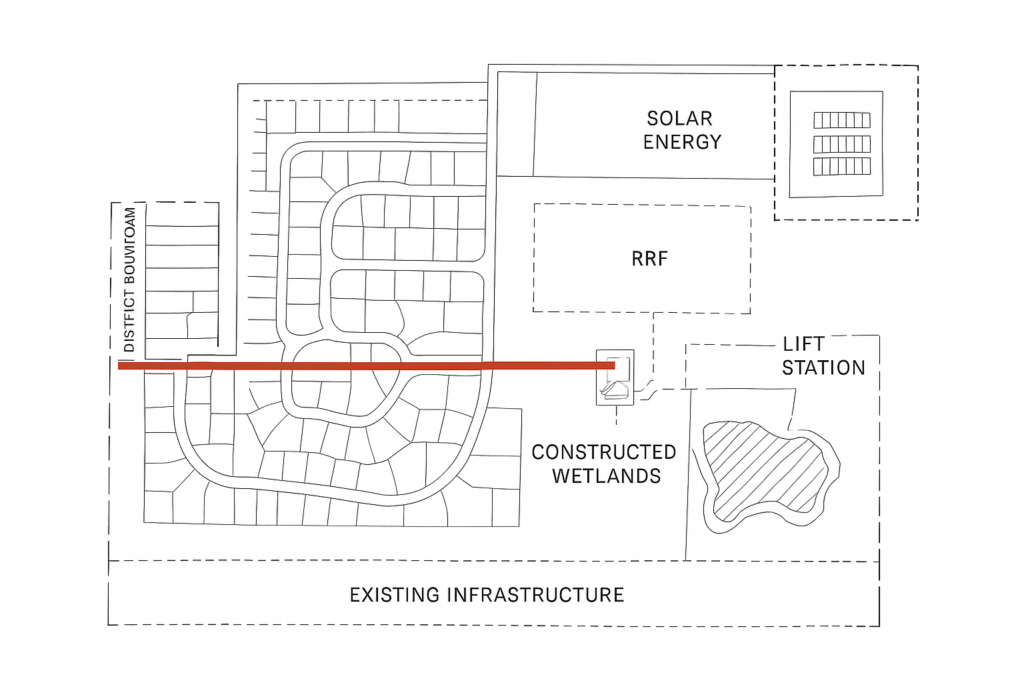
3. Wastewater Utility System Design
3.1 Collection Network
- HDPE or PVC trunk lines to central RRF
- Gravity sewer lines throughout subdivision
- 2–3 lift stations for elevation changes
3.2 Treatment Process (RRF)
Note: The primary RRF, energy park, and constructed wetlands area as a separation places heavy mechanical and logistics operations in an industrial zone while preserving the residential character of the 266-acre subdivision.
- Pre-Treatment: Screening & grit removal
- Primary Treatment: Settling basins
- Secondary (Biological): MBR/MBBR system
- Tertiary: UV + optional RO for high purity
- Solids Processing: Anaerobic digester + dewatering press
- Resource Recovery:
- Struvite crystallizer
- Biogas capture & upgrading
Transportation of screened influent from the residential collection system to the industrial RRF will be handled through a dedicated force-main and engineered crossings under Highway 15, or via shared conveyance agreements that maintain safe separation between industrial traffic and residential access.
3.3 Products Generated
- Electricity via CHP units
- Class A reclaimed water
- Class A biosolids
- Renewable natural gas (RNG)
- Struvite fertilizer
4. Revenue Streams
Annual Revenue Sources
- Reclaimed water sales
- Biosolid fertilizer contracts
- RNG sales to gas grid
- Struvite fertilizer wholesale
- Septage tipping fees
- Sewer service charges
- Utility connection fees
Estimated Annual Revenue
- Per Household Dividend Estimate: ~$4,600/year
- Total Revenue: $4.5M
- Net Operating Income: $2.8M
5. Resident Ownership & Financial Structure
5.1 Utility Cooperative Structure (CUC)
- Each homeowner receives 1 common share
- Voting rights for community governance
5.2 Revenue Bonds (SERBs)
- 5, 10, 20-year options
- Securitized by utility revenues and product sales
5.3 Dividend Allocation
- 25% to reserves & capex
- 50% to resident shareholders
- 25% to bondholders
6. Governance Structure
DISTRICT 01 exists and operate as an independent district that is funded and managed by HSC affiliates directly and indirectly as a nonprofit “Government Unit” under IRS Section 1.170A-9(f)(3)(v) with or other agency as proprietary community investment authority with selected corporate administrators to:
- Offers public–private partnerships to manage family community investment funds that are controlled by internal proprietary electoral bodies outside the local city council and parish police jury.
- 7-member elected Board of Directors
- 3-year staggered terms
- Committees: Finance, Utility, Community Development
- Annual independent audit
- Professional utility management provider contracted
- Operate under corporate policy under a Private Self-Regulatory Organization (SRO) framework that provides oversight of community advisors and investors who serve as stockholders, bondholders, and contractors under domestic or international trust.
- To be established with electoral consent as a civil legislative act under Louisiana Constitution 6:10-12 and operates as a not-for-profit entity in accordance with its pre-developed Articles of Association and administrative ordinance.
- Have an Administration Ordinance designed to manage the district operations through clear due-diligence procedures and a system of checks and balances.
- Have civil-autonomy investments with non-governmental civil legislative authority for local products and services, while ensuring full compliance with all applicable state and federal regulations and sanctions.”
DIVISION 01 has especially created water–wastewater–infrastructure district
with broad operational autonomy, its own governance, and its own revenue system.
Jurisdiction
Louisiana Constitution Article VI, Sections 10–12 allow:
- The creation of special districts by local ordinance or legislative act
- Delegation of public powers to districts
- Ability to issue bonds, levy service fees, and enter public–private partnerships
- Cooperative autonomy and independent governance boards
Louisiana Revised Statutes that support it:
- RS 33:1236 — Parish authority to create special districts
- RS 33:130.11–130.19 — Economic development districts
- RS 33:2740.9 et seq. — Special taxing and utility districts
- RS 40:1500+ — Waterworks and sewer districts
- RS 38:1800+ — Drainage and water management
- RS 12:201+ — Nonprofit corporate authority
- RS 51:1783 (Opportunity Zones) — PPP investment structure
- 7-member elected Board of Directors
- 3-year staggered terms
- Committees: Finance, Utility, Community Development
- Annual independent audit
- Professional utility management provider contracted
HSC does not “own” Division 01 but it will:
- Manage operations
- Provide capital
- Serve as the P3 developer
- Serve as corporate administrator
- Provide trustees, officers, appointed experts
- Receive returns through bonds or services contracts
Permitted Structures:
- P3 Operating Agreement (Public–Private Partnership)
- Utility service provider contract (district owns assets; family office operates)
- Concessionaire Model (family office builds & operates under a long-term concession)
- District Development Agreement
7. Regulatory Roadmap
7.1 Required Approvals
- Parish land use approval
- Louisiana DEQ wastewater permit
- NPDES discharge or reuse permit
- Biosolids Class A certification
- Renewable energy interconnection approval
- Special district formation via Parish police jury or community petition.
7.2 District Structure
Use a Private Utility Subdistrict under HSC authority with bonding powers.
8. Engineering Layout Summary
Key Engineering Elements
- Fertilizer production warehouse
- 12-inch main gravity sewer trunk
- 6–8-inch neighborhood collectors
- Central MBR plant capacity: 0.4–0.8 MGD
- 2 MW solar field with battery storage
- Constructed wetlands for tertiary polishing
9. Offering Memorandum
9.1 Project Entity
Cooperative Division 01+ Hill Scott Corporation HSC
9.2 Securities Offered
- Common stock (1 per household)
- Revenue bonds
9.3 Use of Proceeds
- Construction of wastewater RRF
- Sewer network construction
- Solar & energy park
- Working capital
9.4 Risk Factors
- Market price fluctuations in energy & fertilizer
- Regulatory compliance
- Construction delays
10. Revenue Sharing Agreement
Key Provisions
- Bondholders receive fixed interest + revenue participation
- Quarterly dividend payments
- 50% of net proceeds allocated to shareholders
- Transferability: Shares tied to homeownership
11. Financial Model
11.1 CAPEX Estimates
- RRF facility: $18M
- Sewer infrastructure: $12M
- Energy systems: $6M
- Wetlands: $2M
- Total CAPEX: ~$38M
11.2 OPEX Estimates
$1.6M annually
11.3 NOI Projection
- Year 10: $3.5M
- Year 1: $2.2M
- Year 5: $2.8M
12. Engineering Layouts & Infrastructure
This section provides the foundational engineering design guidelines and recommended specifications for permitting and detailed design teams. It is written to be used by civil, mechanical, process, and electrical engineers as the project basis of design (BoD).
12.1 Design Criteria & Assumptions
- Full build-out residential count (baseline): 600 homes (mid-density). Design for 0.6–0.8 MGD peak wet weather flow (PWWF), with treatment capacity sized for 0.8–1.0 MGD to allow safety margin and future expansion.
- Average per-household wastewater generation: 250–300 gallons per day (gpd) (conservative design) — use 300 gpd for sizing.
- Peak factor: PWWF = 4 × AADF for initial design; confirm with local codes.
- Solids loading: 0.2–0.4 lb BOD5 / capita-day baseline for process design.
- Force-main distance: ~0.2–1.5 miles depending on RRF siting across Highway 15; assume 1,200–5,000 ft in initial layouts.
12.2 Collection System (Within 266-Acre Subdivision)
Gravity Sewers
- Primary trunk: 12″ PVC SDR26 or HDPE (if trenchless) located in main corridors.
- Neighborhood mains: 8″ PVC SDR26 to 10″ PVC depending on tributary flow.
- Service laterals: 4″ PVC from property line to main.
- Manholes: 400–600 ft spacing on trunks, 250–400 ft on laterals (adjust to topography).
Lift Stations
- Lift stations: 2–3 duplex pump stations (duty/standby) sized to pump peak hourly flow from highest basins; each station with capacity ~150–300 gpm with variable-frequency drives (VFDs).
- Forcemain material: HDPE DR11 with fusion-welded joints; sized to 4″–6″ depending on flow and distance to RRF.
- Odor control: Wet-well influent covers, activated carbon canisters on vents, chemical dosing inlet (NaOCl) where needed.
12.3 Force-main & Highway Crossing
- Sizing: For 0.8–1.0 MGD design, force-main dia
- Dedicated force-main from primary lift station to the 46-acre industrial RRF across Highway 15.
- Crossing method options: directional bore (preferred), open-cut with traffic control (if allowed), or encased carrier pipe in concrete casing under roadway.
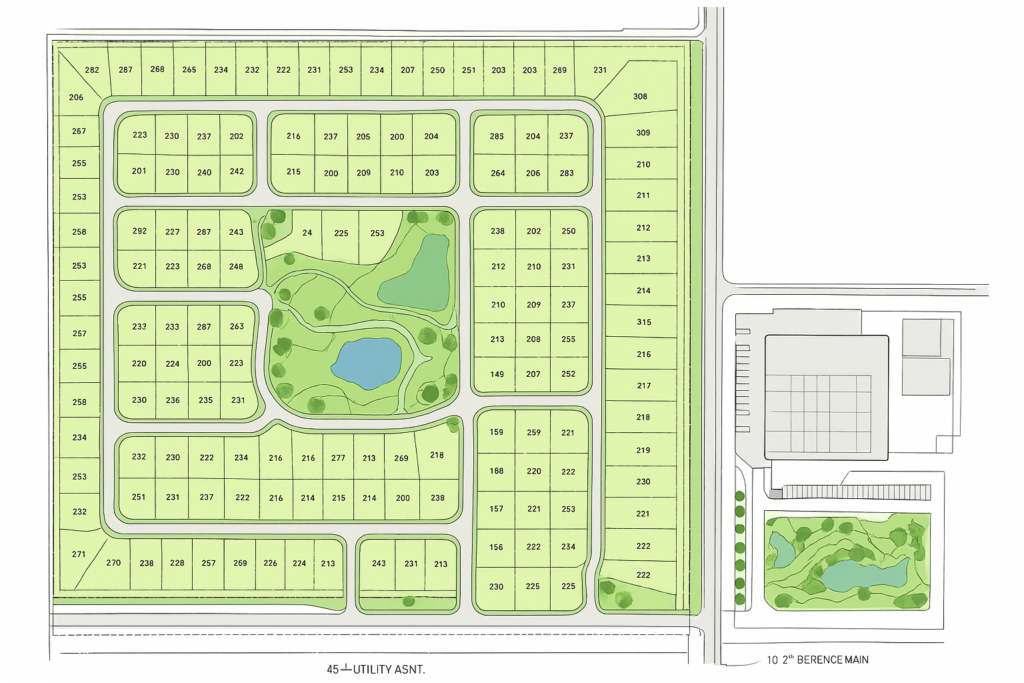
13. Parcel Map & Lot Count (Mid-Density)
1. Total Residential Acreage
- 266 acres total
- Dedicate land as follows:
| Use | Acres | Notes |
| Residential lots | 145 acres | Mix of cottages, standard, and estate lots |
| Roads & Right-of-Way | 45 acres | Arterials, collectors, local streets |
| Parks / Greenways | 35 acres | Active parks, trails, retention ponds |
| Community Amenities | 10 acres | Clubhouse, pool, recreation fields |
| Utility / Drainage / Easements | 31 acres | Force-main corridors, lift stations, stormwater management |
| Total | 266 acres | — |
2. Lot Mix & Count (Mid-Density, 600 Homes Baseline)
| Lot Type | Acres Allocated | Lot Size (acres) | # of Lots |
| Cottage Lots | 35 | 0.14 | 250 |
| Standard Lots | 80 | 0.20 | 325 |
| Estate Lots | 30 | 0.50 | 60 |
| Total | 145 | — | 635 Homes |
Notes:
Roads and easements integrated with underground force-main for wastewater collection.
This layout allows 635 homes while maintaining streets, parks, and greenways.
Flexibility to scale +/- 50 homes by adjusting estate vs. standard lot allocation.
14. Subdivision Layout Concept
- Neighborhood Clusters: Group cottages along internal loops for walkability.
- Standard Lots: Central corridors; easy access to parks, main roads, and lift stations.
- Estate Lots: Perimeter / scenic areas for premium pricing.
- Community Core: Clubhouse, pool, and small commercial / mixed-use amenity near main entrance.
- Greenways & Trails: Connect residential clusters to wetlands, retention ponds, and park nodes.
Diagram: Conceptual parcel map can be created using AutoCAD or GIS based on these parameters. Each lot number, street, and utility easement can be labeled.
14.2 Typical Home Size for 0.26–0.46 Acre Lots
These lot sizes correspond to small-to-moderate single-family lots, usually quarter-acre to half-acre homes.
14.3 Typical Home Square Footage Range
1,200 – 2,400 sq ft per home
Breakdown by lot size:
| Lot Size | Typical House Size | Notes |
|---|---|---|
| 0.26 acre (~11,325 sq ft lot) | 1,200 – 1,800 sq ft | Smaller 3-bedroom homes, cottages, compact ranch homes |
| 0.33 acre (~14,375 sq ft lot) | 1,400 – 2,000 sq ft | Standard suburban-type 3-4 bedroom homes |
| 0.46 acre (~20,000 sq ft lot) | 1,800 – 2,400 sq ft | Larger ranch-style or 4-bedroom family homes |
14.4 Most common home size for rural parishes in Louisiana
About 1,500 – 1,800 sq ft
This aligns with the typical 3-bedroom, 2-bath floor plan frequently built in North Louisiana.
14.5 Designing a subdivision
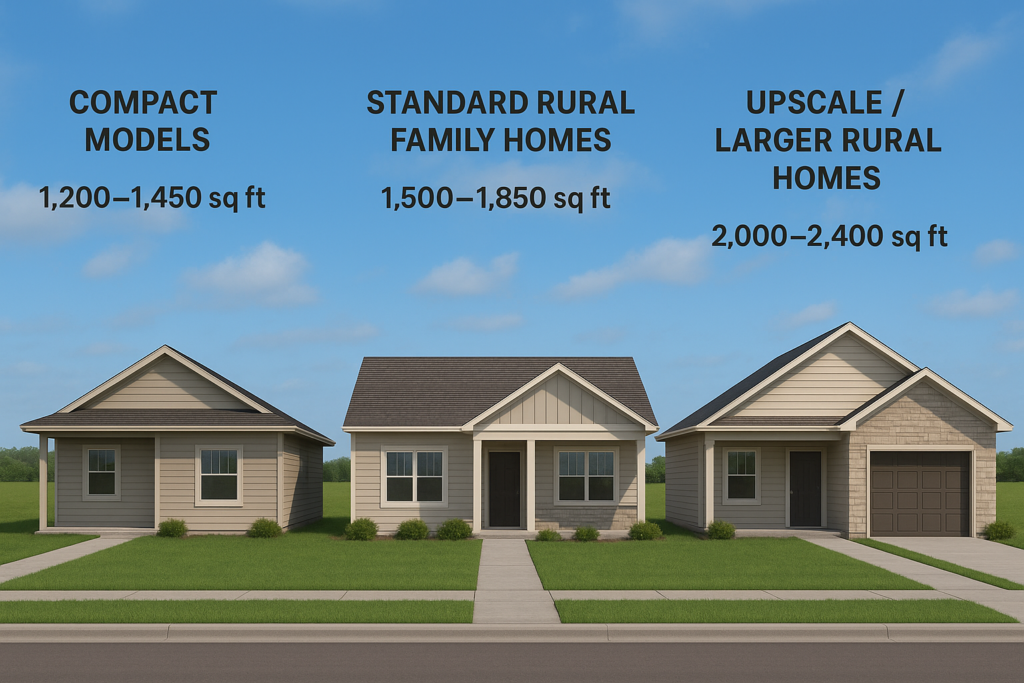
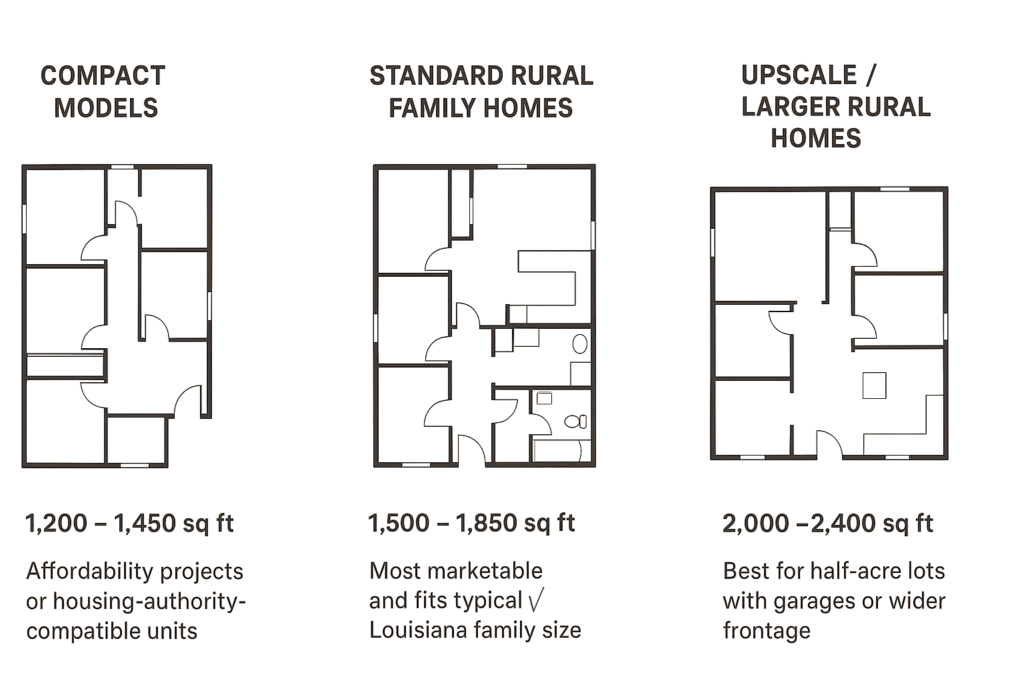
You could plan homes in one of these categories:
- Compact Models
- 1,200–1,450 sq ft
- Best for affordability projects or housing-authority-compatible units.
- Standard Rural Family Homes
- 1,500–1,850 sq ft
- Most marketable and fits typical Louisiana family size.
- Upscale / Larger Rural Homes
- 2,000–2,400 sq ft
- Best for half-acre lots with garage or wider frontage.
14.6 Recommended planning assumption
If you want a single planning number:
Use 1,600 sq ft per home
→ This is right in the center of the realistic range for quarter-acre to half-acre lots.
14.7 Estimated Homes
- Maximum density (smallest lots) – 266 acres ÷ 0.26 acres/lot ≈ 1,023 homes
- Lowest density (largest lots) – 266 acres ÷ 0.46 acres/lot ≈ 578 homes
- Estimated Range ≈ 580 to 1,020 homes (depending on exact lot size)
Important notes
- This is gross density — assumes 100% of the 266 acres is used for housing lots.
- Real subdivisions usually require land for:
- roads
- drainage
- utility easements
- green space
- detention ponds
- rights-of-way
Typically 20–30% of land is lost to infrastructure, so realistic net capacity (after 25% land lost):
- 0.26-acre lots: about 765 homes
- 0.46-acre lots: about 435 homes
Final Practical Planning Range
≈ 430 to 760 buildable lots for typical subdivision design on 266 acres.
15. Expanded Employment & Workforce Plan
15.1. Wage Bands & Training
| Function | Typical Annual Wage | Training Requirements |
| RRF Operator / Tech | $45K–$65K | Operator certification, process training |
| Lab Tech / QA | $50K–$65K | Environmental lab cert, safety |
| Maintenance | $40K–$70K | Electrical/Mechanical licensing, O&M training |
| Warehouse / Packaging | $35K–$50K | Forklift, safety, product handling |
| Distribution / Drivers | $40K–$60K | CDL Class B preferred, route training |
| Solar / Energy Tech | $50K–$70K | PV installation, battery systems, safety |
| Admin / Management | $55K–$90K | Accounting, HR, operations mgmt |
15.2. Workforce Development Programs
- Partner with local community colleges (e.g., Delta Community College, LA Workforce Commission)
- Establish on-site training center at the industrial campus for RRF operations, lab tech, and maintenance
- Apprenticeships & internships for residents to gain skill and employment access
- Offer career ladder programs for operators and warehouse personnel to management roles
15.3. Employment Phasing
| Phase | Staff Increment | Notes |
| Phase 1 (Initial RRF + Force-Main) | 30–40 | Focus on operators, lift station monitoring, minimal packaging |
| Phase 2 (Full RRF + Dewatering + Solar) | 70–100 | Expand operators, lab, warehouse staff, solar techs |
| Phase 3 (Full Build-Out) | 95–140 | Include full packaging, distribution, lab, management, and energy operations |
This parcel map + lot count combined with the expanded employment plan sets the foundation for:
- Long-term workforce planning
- Accurate revenue modeling
- Resident dividend calculation
- Bond offering cash flows
16. Full Financial Model
16.1. Assumptions
| Parameter | Value / Notes |
| Residential Lots | 635 homes (mid-density scenario) |
| Average household wastewater generation | 300 gpd |
| Peak wet-weather flow | 0.8–1.0 MGD (RRF design) |
| Recovered product types | Struvite, biosolids, biochar, reclaimed water, RNG |
| Solar energy capacity | 2 MW DC + 1–2 MWh BESS |
| Industrial campus footprint | 46 acres (RRF + solar + wetlands + warehouse) |
| CAPEX estimates | $25–30M total (RRF + infrastructure + warehouse + energy) |
| OPEX estimates | $1.2–$1.6M/year (treatment, labor, maintenance, energy) |
| Utility rates | $60–$100 per month per household |
| Product pricing | Struvite: $0.75–1.25/lb, Biosolids: $15–25/ton, Reclaimed water: $0.50–1.00/1000 gal, RNG: $8–12/MMBtu |
16.2. Capital Expenditures (CAPEX)
| Component | Estimated Cost ($M) | Notes |
| Collection system (gravity mains, lift stations, force-main) | 4.5 | Includes directional bore under Highway 15 |
| Resource Recovery Facility (RRF) | 10 | MBR/MBBR, digesters, dewatering, struvite recovery |
| Warehouse / Packaging / Distribution | 16 | 650,000+ sq ft warehouse, conveyors, packaging equipment |
| Solar PV + BESS | 3 | Ground-mounted PV arrays + 1–2 MWh storage |
| Constructed Wetlands / Eco-Park | 2 | 20 acres including recreational boardwalks |
| Community infrastructure (roads, parks, amenities) | 6 | Streets, parks, trails, clubhouse, lighting |
| Contingency & permitting | 3 | 10–15% of above |
| Total CAPEX | $44.5M | Phased over 3–6 years |
16.3. Operating Expenses (OPEX / Year)
| Component | Annual Cost ($K) | Notes |
| Labor (RRF + warehouse + solar + admin) | 5,200–6,500 | 95–140 employees |
| Chemicals / Consumables | 250–400 | Coagulants, membranes, cleaning |
| Energy (plant, pumps, lighting) | 200–300 | Net grid purchase after solar export |
| Maintenance & Equipment | 150–250 | Pumps, conveyors, vehicles |
| Insurance & Permitting | 75–125 | Property, liability, air/water permits |
| Misc / Contingency | 100 | Spare parts, minor costs |
| Total OPEX | $5.975M/year (approx.) | May vary depending on energy credit & product revenue |
16.4. Revenue Streams
A. Residential Wastewater Utility
- 635 homes × $80/mo average fee = $50,800/month → $609,600/year
- Peak usage / surcharge fees: additional $150,000/year
- Total wastewater revenue: ~$760K/year
B. Recovered Products
| Product | Units | Price | Revenue ($K/year) |
| Struvite (fertilizer) | 500,000 lbs | $1.00/lb | 500 |
| Biosolids (Class A soil amendment) | 10,000 tons | $20/ton | 200 |
| Biochar (optional) | 500 tons | $300/ton | 150 |
| Reclaimed water (industrial / agricultural) | 100M gallons | $0.80/1000 gal | 80 |
| RNG (from biogas) | 100,000 MMBtu | $10/MMBtu | 1,000 |
| Solar export | 2 MW DC | $0.08/kWh | 200 |
| Warehouse lease (optional tenants) | — | — | 500 |
| Total Product Revenue | — | — | $2.63M–$2.83M |
Total Revenue (Wastewater + Product + Solar + Lease): ~$3.39M–$3.59M/year
16.5. Cash Flow / Dividend Potential for Residents
A. Revenue Bond Coverage
- Annual OPEX: ~$5.975M
- Annual revenue: ~$3.5M (Phase 1–2), full build-out may increase product revenue to $7–12M
- Debt service coverage ratio (DSCR) target: 1.25x
B. Dividend Scenario
- Assuming $25M financed via revenue bonds (CAPEX)
- Interest / principal: ~$1.6M/year (7-year amortizing, 5% coupon)
- Net operating surplus: ~$1.9–2.0M/year available for distribution
- 635 shareholders → ~$3,000/year per household at full build-out (variable depending on revenue growth, product sales, and operational efficiency)
C. Phasing Notes
- Phase 1 (Years 0–2): smaller dividend (~$500–$1,000/household)
- Phase 2 (Years 2–4): dividend grows as product revenue increases (~$1,500–$2,000)
- Phase 3 (Years 4–6+): full dividend potential (~$3,000–$5,000)
16.6. Sensitivity Analysis
| Variable | Low Case | Base Case | High Case |
| Product Revenue | 70% of projected | 100% | 130% |
| OPEX | 110% | 100% | 90% |
| Household Fee Collection | 90% | 100% | 105% |
| Dividend / Household | $2,000 | $3,000 | $4,500 |
The model is conservative, and bond repayment is backed primarily by product revenue + wastewater utility fees.
17. Notes for Bond Structuring
17.1 Structuring
- Revenue bonds can be secured against multiple revenue streams:
- Wastewater utility fees
- Struvite, biosolids, RNG, reclaimed water contracts
- Solar energy export revenue
- Phased financing allows partial drawdown, reducing interest expense in early phases.
- Optional sinking fund for product line expansion.
- Bonds may be divided into tranches:
- Senior: wastewater & product revenue
- Subordinated: solar energy / optional lease revenue
DIVISION 1 – Revenue Bond, Series 2025 (DRAFT OFFERING)
17.2. Issuer
- Scottland Eco-Utility Community District (“SEUC” or “Issuer”)
- Special Purpose District established under Louisiana law, empowered to issue revenue bonds for public-utility and community infrastructure.
17.2. Principal Amount
- Up to $25–30 million, subject to final engineering and phased construction plan
- Series may be issued in tranches to align with Phase 1–3 construction and revenue ramp-up
17.3. Purpose of Bonds
The bonds will finance:
- Residential Collection System
- Gravity mains, lift stations, force-main under Highway 15 connecting 266-acre subdivision to industrial campus
- Resource Recovery Facility (RRF)
- Full-scale biological treatment, digesters, solids dewatering, struvite recovery, biochar, tertiary polishing
- Industrial Campus Infrastructure
- Warehouse, packaging, distribution, laboratory, administrative facilities
- Renewable Energy Assets
- Solar PV + Battery Energy Storage System (BESS), biogas CHP / RNG upgrading
- Constructed Wetlands & Eco-Park
- 20 acres for polishing, habitat, recreation
- Community Amenities & Subdivision Infrastructure
- Roads, parks, trails, clubhouse, stormwater management
- Contingency, Permitting, and Reserves
- Cover unexpected CAPEX/OPEX and regulatory approvals
17.4. Security / Revenue Pledge
- Net revenues of the SEUC including:
- Wastewater utility fees from 266-acre subdivision
- Revenue from sale of recovered products (struvite, biosolids, biochar, reclaimed water, RNG)
- Solar energy export revenue
- Optional warehouse lease income
- Debt Service Reserve Fund: funded at one year of principal + interest
- First-lien pledge on RRF and industrial campus product contracts
17.5. Terms & Features
| Feature | Description |
| Maturity | 20–25 years |
| Coupon | 4.5–5.5% (fixed) |
| Amortization | Level debt service or phased principal repayment to match revenue ramp-up |
| Call / Redemption | Callable after Year 7; optional extraordinary redemption with insurance/FEMA proceeds |
| Coverage Covenant | DSCR ≥ 1.25x (mandatory) |
| Trustee | Independent bond trustee to manage revenue lockbox and disbursements |
17.6. Use of Proceeds
- Phase 1: Build primary collection system, temporary screening, partial RRF modules, lift stations, initial solar PV
- Phase 2: Expand RRF, dewatering, struvite recovery, packaging lines, CHP / RNG, wetlands construction
- Phase 3: Full warehouse fit-out, reclaimed water RO system, final solar/BESS capacity, eco-park, community amenities
- Phased funding reduces early interest costs and allows revenue ramp-up before full bond draw
17.7. Investor Protections
- Revenue lockbox managed by trustee
- Annual audited financial statements
- Rate covenant enforced for utility fees and product sales
- Optional insurance coverage on plant, RRF, and energy assets
- Senior lien on revenues, subordinate tranches can be structured for product expansion or optional green projects
17.8. ESG & Community Benefits
- First-in-region circular economy project
- Revenue-sharing mechanism for residents (dividends from product revenues)
- Renewable energy integration (solar + RNG)
- Green infrastructure / wetlands for environmental stewardship
- Employment for local residents (95–140 jobs with career pathways)
- Proximity to Holly Ridge META for potential reclaimed water contracts
17.9. Estimated Cash Flow & Dividend Potential
- Revenue projection (full build-out): $7.9M–$12.2M/year
- OPEX: ~$5.975M/year
- Net operating surplus: ~$1.9–$2.0M/year available for distribution to shareholders
- Projected annual dividend per household: ~$3,000 (Phase 3, mid-density scenario)
- Phased dividend distribution begins modestly in Phase 1 (~$500–$1,000/household), increasing with product revenue
17.10. Risk Factors (Illustrative)
- Revenue variability from product sales or utility fee collection
- Delays in permitting or construction of RRF or industrial campus
- Market price fluctuations for struvite, biosolids, RNG, or solar energy
- Operational risk for RRF and energy systems
- Weather-related disruptions (stormwater, flooding, hurricane risk)
- Mitigation: contingency reserve, DSCR covenant, long-term offtake agreements, insurance coverage
This draft sets a fully integrated bond offering reflecting your subdivision, industrial campus, multi-product revenue, and revenue-sharing plan for residents.
SEUC Comprehensive Plan — Additions
1. Detailed Employment & Workforce Plan
A. Direct Employment (46-Acre Industrial Campus + Subdivision)
| Function | Positions | Staff | Wage Band | Notes |
| RRF Operators & Technicians | Operators, process techs | 16–22 | $45–65K | 24/7 shifts |
| Lab & Environmental Testing | Lab techs, QA/QC | 4–6 | $50–65K | Product quality & compliance |
| Maintenance & Mechanical | Electricians, plumbers, mechanics | 8–12 | $40–70K | Routine & emergency |
| Warehouse & Packaging | Forklift, packaging, logistics | 40–60 | $35–50K | Product handling, storage |
| Distribution / Truck Drivers | Drivers, dispatch | 15–25 | $40–60K | Local/regional deliveries |
| Solar / Energy Operations | PV & battery techs | 6–10 | $50–70K | Grid tie, BESS operation |
| Administrative & Management | Plant manager, supervisors | 6–8 | $55–90K | Accounting, HR, operations |
| Subdivision O&M | Utility, parks, maintenance | 10–15 | $35–55K | Roads, lift stations, parks |
| Total Direct Jobs | — | 115–158 | — | Phased build-out |
B. Workforce Development Programs
- Prioritize local residents to maximize community economic benefit
- Partner with Delta Community College & Louisiana Workforce Commission
- Offer apprenticeships for RRF operators, lab techs, and warehouse staff
- On-site training facility at industrial campus
- Career ladder programs for operators to management positions
18. Regional Economic Impact Analysis
A. Direct Economic Contribution
- Annual payroll: $5–7M
- O&M purchases: $1–2M/year
- Taxes & fees: ~$500K/year (property, sales, permit)
B. Indirect / Induced Impact
- Local supplier contracts (construction, materials, chemicals)
- Increased local household spending (retail, services) from ~115–158 jobs
- Boost to Franklin Parish employment base (~0.5–1% increase regionally)
C. Total Regional GDP Impact
Multiplier effect: ~2.5x local employment & supply chain benefits
Estimated $15–20M/year total economic activity (direct + indirect + induced)
19. Maps, Diagrams, and Parcel Plans
A. Residential Subdivision (266 Acres)
- Neighborhood clusters: Cottage, standard, estate lots
- Community core: Clubhouse, pool, trails, and parks
- Utility corridors: Lift stations, force-main to RRF
- Greenways & wetlands: Recreational & stormwater functions
B. Industrial Campus (46 Acres)
- RRF footprint (10–12 acres)
- Solar + energy park (10 acres)
- Constructed wetlands / Eco-park (20 acres)
- Warehouse + packaging + lab + admin (650,000+ sq ft)
Diagrams can be delivered as GIS parcel maps, AutoCAD overlays, or PDF site plans, showing lot boundaries, roads, lift stations, and industrial footprint.
20. Bond Offering / Securities Memorandum
Key Sections:
- Issuer: Scottland Eco-Utility Community District
- Purpose of Bonds: RRF, collection system, solar, wetlands, community infrastructure, warehouse
- Principal Amount: $25–30M (phased issuance)
- Security: Revenue pledge from utility fees, product sales, energy export, optional warehouse lease
- Debt Service & Coverage: DSCR ≥1.25x; reserve fund equal to 1-year P+I
- Coupon & Maturity: 4.5–5.5% fixed, 20–25 years
- Redemption / Call: Callable after Year 7, extraordinary redemption allowed
- Investor Protections: Trustee-managed lockbox, audited financials, rate covenant
- ESG & Community Benefits: Circular economy, renewable energy, employment, revenue-sharing for residents
- Risk Factors: Product pricing, operational risk, permitting delays, revenue collection, weather
Optional: Full legal-style preliminary offering memorandum (POM) can be drafted in Word/PDF format including tables, charts, and phased cash flow projections.
Treasury Banking
Treasury banking is a critical function within HSC grant facility, focusing on managing a office’s assets and liabilities, ensuring liquidity, and optimizing financial performance.
Key Functions of Treasury Banking
Liquidity Management:
The treasury department ensures that the bank has sufficient cash flow to meet its obligations. This involves managing daily cash flows, investments, and ensuring that there are adequate reserves to cover unexpected demands.
Asset-Liability Management (ALM):
Treasury teams are responsible for balancing treasury bank’s assets and liabilities to minimize risks associated with interest rates and liquidity.
Risk Management:
Treasury Bank play a vital role in identifying and mitigating financial risks, including interest rate risk, currency risk, and credit risk. HSC utilize various financial instruments, such as derivatives, to hedge against these risks.
Regulatory Compliance:
The treasury bank function must adhere to regulatory requirements set by state, federal and international standards, such as the Basel norms. This includes maintaining adequate capital reserves and ensuring compliance with liquidity requirements.
Trading and Hedging:
HSC engage in trading activities to capitalize on market opportunities and manage its treasury bank’s exposure to fluctuations in interest rates and currency values. This includes executing spot transactions and using hedging strategies to protect the treasury bank’s financial position.
Treasury Bank Account
- Master FBO Account at partner bank.
- API-Based Origination for ACH, wire, SWIFT, RTP.
- Treasury Bank Portal /Cooperative Ledger Synchronization with Family Office Treasury.
- Daily reconciliation between ledger system and FBO account.
- Automated AML/OFAC screening on all outbound transactions.
Ledger-to-Ledger Settlement Flow
Step 1: Member requests credit or payment.
Step 2: Cooperative ledger debits member and credits vendor or Treasury Bank Portal account.
Step 3: Treasury exports transaction via JSON/XML API.
Step 4: Bank middleware converts request to ACH CCD/CTX or Wire.
Step 5: Bank settlement posts to FBO account.
Step 6: Treasury Bank Portal reconciles ledger with bank records.
Typical Home Size
Typical Home Size for 0.26–0.46 Acre Lots
These lot sizes correspond to small-to-moderate single-family lots, usually quarter-acre to half-acre homes.
Typical Home Square Footage Range
1,200 – 2,400 sq ft per home
Breakdown by lot size:
| Lot Size | Typical House Size | Notes |
|---|---|---|
| 0.26 acre (~11,325 sq ft lot) | 1,200 – 1,800 sq ft | Smaller 3-bedroom homes, cottages, compact ranch homes |
| 0.33 acre (~14,375 sq ft lot) | 1,400 – 2,000 sq ft | Standard suburban-type 3-4 bedroom homes |
| 0.46 acre (~20,000 sq ft lot) | 1,800 – 2,400 sq ft | Larger ranch-style or 4-bedroom family homes |
Most common home size for rural parishes in Louisiana
About 1,500 – 1,800 sq ft
This aligns with the typical 3-bedroom, 2-bath floor plan frequently built in North Louisiana.
Designing a subdivision
You could plan homes in one of these categories:
- Compact Models
- 1,200–1,450 sq ft
- Best for affordability projects or housing-authority-compatible units.
- Standard Rural Family Homes
- 1,500–1,850 sq ft
- Most marketable and fits typical Louisiana family size.
- Upscale / Larger Rural Homes
- 2,000–2,400 sq ft
- Best for half-acre lots with garage or wider frontage.
⭐ Recommended planning assumption
If you want a single planning number:
Use 1,600 sq ft per home
→ This is right in the center of the realistic range for quarter-acre to half-acre lots.
Estimated Homes
1. Maximum density (smallest lots)
266 acres ÷ 0.26 acres/lot ≈ 1,023 homes
2. Lowest density (largest lots)
266 acres ÷ 0.46 acres/lot ≈ 578 homes
3 Estimated Range ≈ 580 to 1,020 homes
(depending on exact lot size)
⚠️ Important notes
- This is gross density — assumes 100% of the 266 acres is used for housing lots.
- Real subdivisions usually require land for:
- roads
- drainage
- utility easements
- green space
- detention ponds
- rights-of-way
Typically 20–30% of land is lost to infrastructure.
If we factor that in:
Realistic net capacity (after 25% land lost):
- 0.26-acre lots: about 765 homes
- 0.46-acre lots: about 435 homes
Final Practical Planning Range
≈ 430 to 760 buildable lots
for typical subdivision design on 266 acres.